Showing posts with label geospatial. Show all posts

Wednesday, December 17, 2014

Disruptive Technologies Mean A Fast Changing Landscape for Utilities


Article by Peter Batty; originally published in Geospatial World, http://ow.ly/G0xl8

The major growth in Web and mobile applications is starting to have significant impact in the utility sector. But, will this disruption in the technological environment help the utility sector in simplifying their solutions? 
The geospatial industry is currently going through substantial changes, and these are starting to have a significant impact in the utility sector, as well as other industries. Clayton Christensen talks about the idea of “disruptive technologies” in his book The Innovator’s Dilemma. He describes examples from many industries of how technologies which were initially regarded as too “low end” for mainstream users improve in functionality and performance over time, to the point where they can meet the needs of users in the mainstream market, and can start to displace the previous generation of more complex solutions, typically with a simpler and lower cost approach. Google Maps is a prime example of a disruptive technology in the enterprise geospatial market: it was initially focused on the simpler consumer market, but it, and other similar systems, have grown in capability and now have many applications in the enterprise.

Another way of looking at changes happening in the IT market is the idea of consumer-led IT. It used to be the case that technology innovations would happen first in enterprise systems and then later these would flow to the consumer. But the consumer technology market is now so large that innovations tend to happen first there. Google Maps is one example, as just mentioned. Another is the huge growth in smartphones and tablets which was driven by the consumer market, and while adoption in the enterprise is growing, it still lags significantly behind.

The Web mapping revolution

▶ Google Maps: Launched in 2005, Google Maps dominated the consumer web mapping space due its ease of use and performance, together with an easy mechanism to incorporate it into third party websites. A common complaint I have heard from utility GIS users is “why isn’t our expensive GIS as fast and easy to use as Google Maps?” In recent years we have started to see more use of Google Maps, and other similar modern Web mapping technologies, in utility environments. This is typically in addition to a traditional GIS: the Web application makes that data available to a much larger number of users.

The ease of use and familiarity of a Google Maps style solution is extremely important in being able to roll out this type of solution to many users in an enterprise, who typically are not familiar with GIS. A key aim should be that users can use at least basic features of the system without any training. A danger is that “GIS experts” sometimes have a tendency to add too many features and too much complexity to web applications, which can overwhelm the typical user.

▶ Open source software: There are various alternatives to Google Maps that provide a similar style of simple Web map, including Bing Maps and MapQuest. There are also multiple open source software solutions, including the Leaflet and OpenLayers JavaScript libraries, which are very widely used by Web developers. In general, there are lot of geospatial open source software components available now that have the capabilities and robustness to be used in serious enterprise applications — widely used server side components include GeoServer and the PostGIS spatial relational database. In some cases, utilities are directly implementing solutions based on these components, in others third party software vendors are building utility focused solutions on top of them.

▶ Enterprise mashups: Web applications commonly make use of lightweight integration techniques to pull data from multiple websites, an approach that is often known as a “mashup”. Similar techniques can be used in the enterprise to visualise many different datasets on the same map. Examples in utilities include jobs, outages, crew locations, customer information and more. Location provides a link between these different datasets that can provide insights that would not otherwise be apparent. For example, an electric utility might look at how its recent tree-related outages relate to vegetation management operations over the past year.


Example of electric network data overlaid on
Google Map backdrop, and integrated with
Google Street View
Example of electric network data overlaid on Google Map backdrop, and integrated with Google Street View

In general, it is much simpler to share data between different geospatial systems than it used to be, which makes it much easier for enterprises to implement solutions from multiple geospatial vendors. In many cases the large established GIS vendors may not have a strong incentive to embrace disruptive lower cost web solutions from Google and others — this is part of the classic “innovator’s dilemma” that Clayton Christensen wrote about.

▶ The mobile revolution: Mobile geospatial applications in utilities are currently undergoing substantial change. Widely available wireless network communications enable real-time communication to and from field workers, which opens up many possibilities for significantly improving business processes. When combined with the growth in smart network- connected devices on utility networks (smart meters, intelligent switches and sensors, etc), everyone in a utility, either in the office or in the field can have a near real time view of the current state of the enterprise. Many of the established field mapping solutions at utilities pre-date Google Maps and modern wireless networks, and are geared to downloading data periodically and working offline, rather than working with real time data. Of course, the ability to work offline when needed is a key requirement, but newer systems are designed to work either online or offline as needed. Managing large amounts of offline geospatial data remains something of a challenge — there is just inherently quite a lot of administration needed to keep hundreds or thousands of offline copies of a large geospatial database in sync.

A new technology that shows promise for offline working is HTML5, the latest Web technology which is supported across all modern browsers. This provides the ability to store a moderate amount of data offline in the browser — not enough for large portions of a typical utility’s territory, but enough to store data for a small number of electric circuits say, or a typical day’s worth of jobs. HTML5 offline capabilities are still somewhat immature and differ across browsers, but over the next few years as this technology develops and wireless network coverage continues to improve, it is likely that the role of HTML5 offline storage will grow, relative to the traditional download and sync of large data volumes.

One thing worth noting is that Google terms of service specifically prohibit use of either its data or code offline, which limits its applicability for utility field applications. The open source libraries Leaflet or OpenLayers are alternatives that can be used offline, and for basemap data, OpenStreetMap provides a good alternative.

Another key trend in mobile applications is the use of tablets and smartphones, rather than laptops or quite limited PDAs or GPS devices used in older generation field applications. With high-quality touch screens and built in wireless communications, GPS and cameras, modern tablets are excellent devices for field applications. A challenge here is that the mobile market is quite fragmented in terms of operating systems, with Android, Apple’s iOS and Microsoft all having a reasonable presence in the enterprise market. No clear winner has yet emerged in this space, and there is also a trend towards “Bring Your Own Device” (BYOD), where employees can use their personal phones or tablets for business applications.

All of these factors combine to make a cross-platform mobile strategy, with applications that can run across all these operating systems, a desirable approach. Web-based applications work in this regard of course. Handling offline work in a cross platform way is a little more effort. There are some cross platform development tools such as PhoneGap, or its open source equivalent Apache Cordova, which enable applications to be compiled from HTML and JavaScript into native applications on all of these platforms. Phonegap also provides a means to have greater access to the mobile device, including local storage, than is available via a web application.
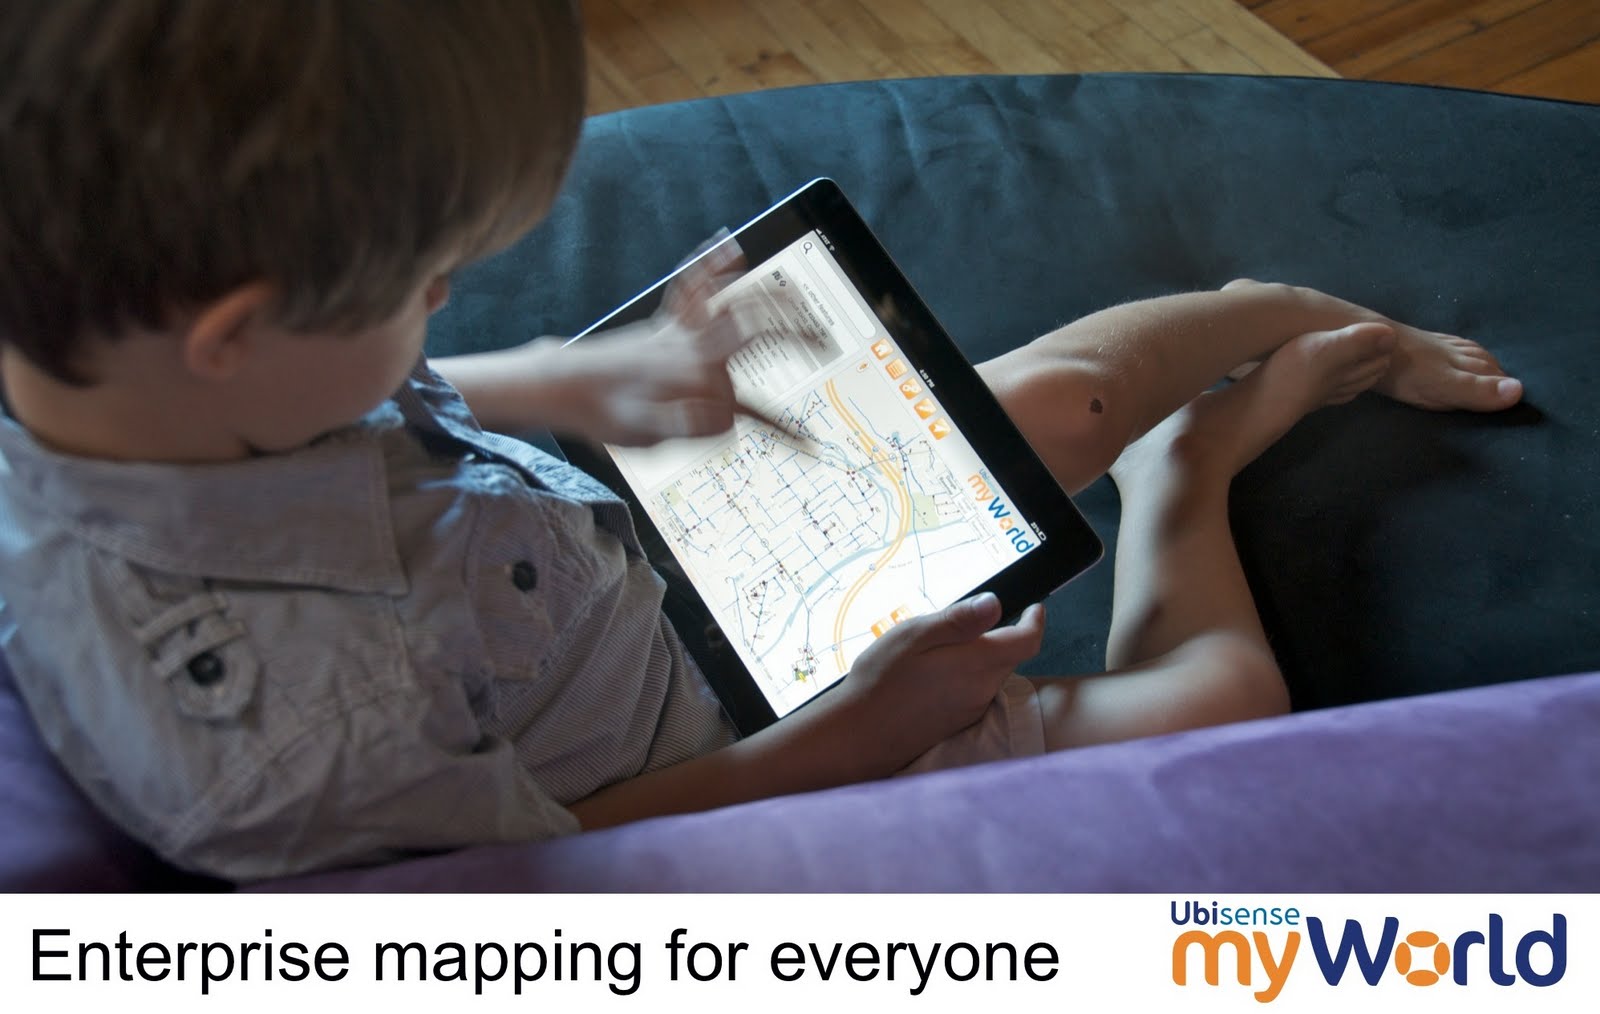
Utility mapping application running on an iPad
▶ Crowdsourcing: Another interesting development that has grown primarily in the consumer space, but increasingly has application in the enterprise, is the use of crowdsourcing for creation and maintenance of geospatial data. The best known example is OpenStreetMap, a map of the world that is free to use and can be edited by anyone. In many parts of the world its quality is as good as or better than commercial equivalents.

One impact of OpenStreetMap is simply in its potential for use as a basemap layer in enterprise applications, especially offline where alternatives like Google Maps cannot be used. But it is also significant in that it has shown that good quality map products can be created by non-specialist users without any special training. The lesson for enterprises here is that it makes sense to enable more users of the data, especially users in the field, participate in contributing corrections to data if they find errors. In the past it has generally been assumed that most field workers did not have the skills to do these sort of updates, but OpenStreetMap has shown that this is not the case, especially where users have a vested interest in seeing the data improved, which utility field workers do.

Another good example of crowdsourcing is for damage assessment, after a storm or other incident. All smartphones now have the ability to take geotagged photos, that have a GPS coordinate stored with them indicating where they were taken. It is easy to load and display such pictures on a map, either by asking people to email them, upload them to a website, or by pulling photos from social media sites like Twitter, Instagram or Facebook. This can provide a very rich source of data for quickly evaluating the extent of damage.

Summing up
Currently, the most active area of change in the utility geospatial market is in web and mobile applications, leveraging the major technology changes that have been seen in these areas in recent years. Major benefits can be achieved with a relatively small incremental investment, by expanding use of geospatial data to many more users and many more business processes. Technology originating in the consumer market, both software and hardware, is having a major influence.

There is not major change in backend traditional GIS platforms — in general these are well entrenched, with a lot of customisation and integration with other systems. There is little obvious benefit to changing, and a lot of cost to do so.

As smart grid technologies roll out over the coming years, there may be more change in backend systems, as there is more pressure to handle real time data. Currently network applications are handled by a mix of GIS, OMS (Outage Management Systems), DMS (Distribution Management Systems), EMS (Energy Management Systems), SCADA (Supervisory Control and Data Acquistion), and MDMS (Meter Data Management Systems), with varying degrees of integration between them. It seems as though there should be opportunity to rationalise the number of systems involved, but this is a complex challenge both technically and in terms of organisation and process issues.

- See more at: http://geospatialworld.net/Magazine/MArticleView.aspx?aid=31228#sthash.en8SZNg4.dpuf


Thursday, September 18, 2014

The Ubisense Team -- Denver, CO

All North American Ubisense employees gathered in Denver, CO for a collaborative and educational 3-day team meeting. 


Friday, May 30, 2014

FME World Tour Recap: Using Data to Connect, Transform, and Automate Applications

By Edson Enohi

FME World Tour is an event happening around the world in more than 50 cities from April through May bringing the most recent information about data connecting applications, transforming, and automating. This year, for the first time as part of this FME World Tour, FME partner Geoplan (Ubisense), together with FME creator Safe Software, organized the event in Japan. Around 100 attendees participated at the event held in Tokyo and Nagoya.

In the first half-session of the event, top academic researchers from Tokyo university (Kato professor), Nagoya university (Kawaguchi professor), and OpenStreet Foundation Japan (Furuhashi leader) were invited as keynote speakers to talk about their recent works related to OpenData. In the second half-session, FME use cases were presented by the end customer (Pragmatica company, Iijima-san) and FME products were introduced by Geoplan and Safe Software to the audience.

Conference opening by Takushi Oda (master of ceremonies)

The Kato professor, a specialist in natural disaster studies for big cities, pointed out the preparation needs in Japan for disaster prevention and the lessons learned from the past earthquakes. The studies of the cities’ damages were explained depending on the intensity of earthquake and illustrated by several thematics on the maps. Opendata is providing great contributions, visualizing and sharing the data to better understand the local area, identify new issues, and locate houses of elderly people, which might help to save more lives during critical situations.

On the crisis management, the following three points become important: self-help, mutual assistance, and public body assistances. The professor emphasized the importance of keeping sustainability of these points.
The Kawaguchi professor, a specialist in location services, information pointed out cases of using collected big data of people moving around Nagoya station area. The data were analyzed by different times of the day, combining the location data inside the station and the outside data. Depending on the day and time, different services might be offered, and big data analytics provide good information for that.

The Furuhashi leader from OpenStreetMap Foundation Japan pointed out the increase of people interested in OpenStreetMap, made the audience learn the word “CCBY,” which means free to copy, print, and reuse. Displaying “CCBY’ is the only requirement to use OpenStreetmap. The Haiti earthquake was illustrated as a case of the OpenstreetMap community helping to create maps for Haiti in a short time, supporting the UN rescuers’ logistics during the disaster.

FME helps to move data from hundreds of different formats enabling use and sharing. Iijima-san from Pragmatica explained cases of transforming data by reprojecting, aggregating, summarizing, extracting coordinates, translating data, extracting, transforming to raster, etc.


FME Introduction by Edson Enohi
The new FME 2014 is supporting new formats for data reading and writing from Amazon Cloud Services, Google Cloud services, Revit (3D/BIM), etc. Among these formats, Google Maps Engine (GME) formats were highlighted, and cities like San Jose and Edmonton are loading several datasets into Google Map Gallery and sharing it with the public for better services. As an example, search Google for “Edmonton map gallery” to find around 80 datasets street project constructions, soccer fields, tree species, etc. Vancouver and San Francisco are also proactively using FME to open their data from several input sources into their web sites.

The 3D/BIM session also attracted the attention of the audience, with Kevin from Safe Software highlighting cases of using cityGML, IFC, Sketchup, and Revit format . For example, from complex BIM data, visualize it on the FME inspector, routing the data per floor, extracting spaces, or volumes from data.

In summary, Opendata, Big data, data analytics, cloud, and 3D/BIM are hot topics from the Geospatial market. New business opportunities are just starting from these segments, and the audience was eager to get the latest information from the event.

I am already looking forward for the next year FME World Tour!

Monday, May 19, 2014

We Are Now a Google Enterprise Maps Authorized Partner

Ubisense has become an Authorized Partner of solutions based on Google’s Enterprise Maps for Business technologies. This new designation from Google enables customers to more easily assess Ubisense’s expertise advising on and deploying Google products. In conjunction with this strategic partnership, Ubisense today formally announced Ubisense myWorld 2.0, an intuitive location intelligence platform that integrates Google Maps for Business technologies and provides unmatched visibility into an enterprise’s operations, significantly enhancing operational awareness and enabling businesses to operate more effectively.
Ubisense provides location intelligence solutions that address unique enterprise visibility challenges, and as an Authorized Partner, Ubisense can now provide Google Maps for Business integration and OEM licenses to its customers in a simple and cost-efficient manner. Ubisense myWorld brings critical enterprise information together into a single application that can be accessed via any standard web browser on any smart device. Ubisense myWorld incorporates network asset data, work orders, customer information, and other critical operational data from a variety of spatial and enterprise systems vendors. Additionally, Ubisense myWorld can be integrated with Google Maps for Business solutions, including Google Maps, Google Search, Google Earth, Google Elevation and Google Street View with Ubisense myWorld.
“Google Maps give our customers a smart, simple, and fast way to view complex business operations so they can quickly understand the state of operations and make better and more informed business decisions,” said Jay Cadman, vice president of business development, Ubisense. “In, say, an outage caused by a natural disaster, having this detailed view of an organization’s operations in real time enables our customers to respond to safety issues, such as downed power lines, with the right equipment and safety precautions the first time. They can keep their employees and customers safer and restore services faster. Every telecommunications and utility company in the world strives for that and now we’re able to deliver a solution that enables them to achieve both goals.”
Google Streeview being shown in myWorld
Using Ubisense myWorld with Google Maps technologies, Ubisense customers can realize a number of benefits that can significantly impact an organization’s bottom line and improve customer service. Ubisense myWorld customers gain the ability to react to issues and potentially harmful situations sooner and are better prepared to solve issues faster, work more efficiently, and enhance their customer service and support. Rapidly gaining traction among telecommunications and utility companies, Ubisense myWorld is already used by 26 customers spanning five continents. Ubisense customers are using Ubisense myWorld for many critical business processes, including storm damage assessment, network operations, gas leak surveying, field mobility and customer service.
Google Maps for Business brings the power of Google Maps to an organization, providing simple, familiar mapping technology to the workplace. Users can layer their data on top of Google’s base map and create their own maps and geospatial applications that can be used by anyone — anytime, anywhere. By using any of Google Maps business solutions, including Google Maps Engine, Google Maps Engine Pro, Google Maps Coordinate or the Google Maps APIs, organizations and their employees can rely on maps that are comprehensive, easy-to-use and always up to date.
The Google Maps Partner Program includes companies globally that sell, service and customize Google Maps for business solutions for their customers. As a part of the Google Maps Partner Program, Ubisense receives training, support and deployment tools from Google.

Thursday, April 24, 2014

The Latest 3D Measurement Technology

Written by: Langley Willauer

The SPAR Conference is all about 3D measurement technology, so when the annual show came to Colorado Springs last week, Ubisense was there scouring for technologies that would help our customers.

Applications included architectural preservation, inside-building models for SWAT teams, crime scene investigation tools; all manner and form of data collection for engineering and design projects.

First, scanners. Since being invented years ago, the technology has diversified and expanded. Indoor and outdoor scanners were on display with various accuracies and ranges. There was a lot of buzz about the scanner mounted in a prototype phone as part of Google’s Project Tango. And there were scanners that clipped onto iPads which created little mapping machines.

And what do get from a scanner? Well, a point cloud. Cool sounding, trendy even, but not very useful in and of itself. So there were software and service providers on the floor too, companies who, with varying degrees of automation, could turn a point cloud into a 3D model that an engineer would recognize.

For example, a Company called New Spin was doing prototype work with one of our customers, American Electric Power. They were placing their scanner at various locations inside a substation, a process that eventually led to a functioning 3D model where engineers could safely take accurate measurements and try “what if” scenarios with their designs in the existing model.

But scanners aren’t cameras. So every deployed scanner seems to also have a companion camera for capturing the image that can be “draped” over the scan. Those iPad scanners appeared to be able to do this on the fly, going from waving the thing around to a working, full-color 3D model of the 10 feet around you in a few seconds. Very compelling technology, to be sure.

Handheld scanners that clip onto iPads are the latest thing
Where does this all fit in? Some utility customers are already employing scanning companies to map poles, wires, and roads. Helicopter-based scanners have been flown in transmission-line corridors for years, mapping tree clearances. For our manufacturing customers, this technology could map indoor spaces quickly and speed up deployment of location-based technologies. For our natural gas customers, a gas leak investigation is similar to a crime scene investigation, so why not adapt this technology for field workers; and certainly exposed pipe deserves to be mapped as closely as possible before it’s covered up again.


Watch this space!

Friday, August 30, 2013

myWorld Plays Critical Role in Hurricane Sandy Recovery


Save Time & Increase Productivity with VeroTrack

VeroTrack highlights facilities surveyed and records gas readings and GPS coordinates automatically, eliminating the need to highlight paper maps and manually enter data. The gas leak survey tracking system integrates with a GIS and creates standardized reports and auditable records. Additionally, supervisors can view the status of each field surveyor in near real-time to ascertain progress at any given moment.


Natural gas utilities face increasingly stringent regulations that are requiring them to upgrade their internal systems to comply with standards in a more efficient and cost-effective way. VeroTrack enables natural gas utilities to save significant time and cost associated with surveying and reporting, and helps to ensure compliance with state and federal regulations.


Monday, May 13, 2013

Black Hills Corporation selects Ubisense for Network Conflation Solution

Cambridge, UK - Ubisense Group plc (“Ubisense” or the “Company”) (AIM:UBI), a market leader in location based smart technology, announces it has been selected by Black Hills Corporation for a network asset realignment project.

Black Hills Corporation, a leading North American Energy Company has selected Ubisense and strategic partner, we-do-IT, to provide network asset realignment services for its operations in Iowa, Kansas, Nebraska, Wyoming and Colorado.

The Ubisense solution will align Black Hills Corporation’s electric and gas utility assets with up-to-date basemaps to provide their operations with accurate network data to facilitate and support planning, design, customer service, maintenance and support across a wide area of coverage. The Project entails adjusting areas of approximately 2,430,493 nodes with accurate parcel information.

Richard Green, CEO of Ubisense said: “We are delighted to have been selected by Black Hills Corporation for this important project. Our innovative network alignment solution provides the fundamental building blocks of an accurate utility network. This will provide the foundation upon which other activities, such as service restoration, can be provided with a high degree of certainty of the integrity of the network.”

Thursday, April 12, 2012

Latest News: Ubisense lands milestone deals with American utilities

Source: Cambume (Cambridge Business Media)
April 12, 2012
Author // Lautaro Vargas

Three North American utilities are to deploy Ubisense's gas leak detection software to improve real-time surveying of over 11,500 miles of natural gas distribution and transmission pipelines.

They are the first deals of Ubisense's VeroTrack product following the integration of the InMaps acquisition made in September 2011.

"Ubisense VeroTrack automatically tracks what was surveyed where, by whom and when," said Richard Green, Ubisense CEO. "And it does so with a 15-20 per cent cost savings over current manual processes."
Ubisense has to date been more readily associate with its manufacturing and assembly tools, but Green has always stated there is a broad range of applications for its real-time location solutions.

"We are pleased with the traction Ubisense Vero Track is receiving – the feedback we have had from customers has been positive and we expect the momentum to continue across our Geospatial offering," said Green.

Ubisense says the VeroTrack software increases surveying efficiency by 20 per cent by allowing users to automatically track and mark progress, highlight problem areas, and store the data for quick retrieval, while also automatically highlighting facilities surveyed and recording gas detector readings.

(end)

Thursday, February 09, 2012

Employee Spotlight: Deb Miller

Name: Deb Miller
Hometown: Vancouver, B.C.
Ubisense Location: Denver, CO
Ubisense Department: Geospatial
Education: Master’s Degree in Computer Science; Master’s Diploma in Cognitive Science

How long have you been with Ubisense and what is your background?
Deb: I started with Ubisense in 2004, but have been in GIS now for 15 years. I originally started with GeoData Solutions, which was one of the first Smallworld consulting companies in the U.S. After that, I ran a small consulting company before finally joining Ubisense.

In university, I specialized in Artificial Intelligence, and during my master’s degree, I developed a neural net to control lighting in a house. It was actually installed in my professor’s experimental house, and to test it, I had to walk around and flap my arms to set off the motion detectors.

What’s a typical day like for you?
Deb: Currently I’m working on a major installation of Smallworld GIS and PowerOn Outage Management at a north west utility.

What is the most significant trend you’ve seen in your field?
Deb: GIS has followed the same trend as technology in general: Geospatial solutions have been getting faster, better, more affordable, and more accessible. GIS solutions used to exist only on expensive IBM mainframes; now they’re embedded everywhere, in every phone and tablet computer. MyWorld pushes that trend even further, bringing enterprise GIS solutions to any web-enabled device. It’s a pretty exciting time to be in the industry.

How did you become interested in GIS?
Deb: When I finished my master’s degree – and gave up my career as an arm flapper – I ended up in GIS almost by accident. Russ Chandler, a friend, was starting GeoData and offered me a position. I planned to stay a couple of years, but got hooked on Smallworld and never looked back. I was fortunate to start on some very interesting work; for example, I became the chief architect of the PowerOn network model, which provided some major design and mathematical challenges.

What was your very first job?
Deb: My first job, in high school and first year in college, was a librarian for a children’s library. When I wasn’t shelving books or studying, I got a chance to read some serious classics; my favorite: Maurice Sendak’s Where the Wild Things Are.

What do you enjoy doing in your time off?
Deb: I like to spend time outdoors – mostly hiking and biking; especially winter hiking. I enjoy travel and spent a year in Europe, the middle east, and North Africa. I was also fortunate to be able to spend 4 months in South America, mainly camping and hiking in the national parks and wilderness areas of Peru, Bolivia, Argentina, and Chile.

What is your favorite city?
Deb: It’s really tough to choose just one city, so I’ll name a few: Florence, Italy (art and food), Goreme, Turkey (amazing rock formations and friendliest people), Chachas, Peru (this small village is so remote it has no roads or electricity, and can only reached by a grueling all-day trek down a steep canyon, and back up the other side).


Jumping a crevasse


Tuesday, November 29, 2011

GIS Case Studies: What are people doing with our systems?

1. Black Hills Corporation
Project: Electric Office Implementation

Challenges: The rapid growth of the business left BHC with many overlapping information technology systems. As a result, BHC commissioned multiple projects to consolidate the various systems into a single corporate standard based on the GE Smallworld Office Suite platform.

Ubisense Solution: Ubisense completed a system upgrade evaluation phase which concluded that the GE Office Suites (EO and GDO) were the best option for BHC. Ubisense is currently working with BHC to implement Electric Office and Gas Distribution Office. The new solution has been successfully deployed in multiple regions.

Results: "Standardizing all business units on one platform and database is a critical priority for Black Hills," said Matt Seidl, Manager of GIS Support at Black Hills Corp. "The Ubisense team brought a tremendous amount of experience to the project, which as helped us make decisions quickly. We were impressed by Ubisense' professionalism, organizational and management skills, and Smallworld experience."

2. First Energy
Project: Electric Office Project Development
Challenges: First Energy, a long time PowerOn customer, was having issues with the quality of GIS data that was being fed to PowerOn.

Ubisense Solution: Ubisense worked closely with customer to identify the root cause of the data quality issues, and developed the PowerOn Integrity Checker application to identify and resolve data quality issues that impact OMS.

Results: The PowerOn Integrity Checker has greatly improved the quality of First Energy's OMS data. Our solution included automated data repair actions and a logging mechanism to identify areas where manual fixes are required.

3. Duke Energy
Project: Electric Office Implementation

Challenges: The merger of Duke and Cineregy left Duke with many overlapping information technology organizations and systems. Duke commissioned multiple projects to consolidate the various systems into a single corporate standard based on the GE Smallworld Office Suite platform. Duke was the first Electric Office customer.

Ubisense Solution: Ubisense is providing project management, development support, and day to day operational support for Duke's Office Suite implementation. Currently we have 8 consultants assigned to this project, working on EO, GDO, and GTO.

Results: With the support of Ubisense, Duke has successfully rolled out the GE Office Suite projects to several regions.

How can Ubisense help?
  • Extensive experience with enterprise GIS for utilities and communications industries
  • Trusted partner to mare than 25 customers around the world
  • Currently over 400 customers in 30 countries
  • Most of our team has more than 15 years experience with the full Smallworld project suite across a broad range of industries and applications
  • Founders Richard Green (CEO) and David Theriault were founders of GE Smallworld. Team includes Peter Batty, Terry Phebey, Jorg Poswig, Russ Chandler, and Dave Harris
  • Our team has direct experience with all the major GIS technologies: GE Smallworld, Intergraph, ESRI, AutoCAD
  • We can provide strategic advice and coaching for business and technical direction, merging utilities, and for data integrity business impact analysis
  • We are leading the way in bringing emerging technology to our customers: MyWorld, Google Maps, OpenStreet Map, Field and Web based tools to bring the most out of geospatial information investment.

Wednesday, September 28, 2011

Latest News: Ubisense Launches FTTx Planning System in North America

Proven Product Reduces Capital Costs and Shortens Time to Revenue for Fiber Rollouts

 DENVER, Sept. 28, 2011 – Ubisense and atesio announced today the North American release of the Ubisense FTTx Planning System. The product automates the strategic planning of fiber access networks and significantly reduces the time and capital investment required for service providers to deliver fiber connectivity to homes and businesses. The solution is in regular use at Deutsche Telekom, one of the largest telecom operators in the world with approximately 40 million access lines.

The Ubisense FTTx Planning System reduces the time it takes to analyze, plan and estimate a cost-optimized, structurally sound network design and configuration from several weeks to a few hours. The solution quickly analyzes multiple planning alternatives to find the scenario that balances revenue and capital costs across dozens of variables. It uses available infrastructure data to produce an optimized network plan that includes equipment and cable material quantities and cost estimates for various deployment scenarios such as greenfield and brownfield.

“We wanted to bring our customers a solution that would get them to market faster, with the best possible network configuration,” said Scott Casey, Ubisense Vice President of Telecom Solutions. “Planning a cost optimized fiber access network with manual methods is daunting – there are simply too many factors and alternatives to process efficiently. With our solution, network operators can quickly create plans based on their existing infrastructure and business requirements.”

Ubisense partnered with atesio on the development of the FTTx Planning System. The solution uses atesio’s powerful computation engine and high-end mathematical optimization algorithms to ensure designs minimize total network deployment costs. Planners quickly get a comprehensive view of the economic efficiency of various planning options, can adjust input parameters and rerun calculations as often as needed to arrive at the optimal network design.

The Ubisense FTTx Planning System integrates with Ubisense myWorld to allow planners to perform desk survey verification of the proposed network layouts against real world conditions using Google Maps API Premier and Street View for Google Maps. The product is also fully integrated with GE’s Smallworld Core Spatial Technology.

Ubisense will demonstrate the FTTx Planning System at the FTTH Expo in Orlando, September 28-30, 2011.

For more information visit http://www.ubisense.net/en/consulting/geo-solutions/ubisense-fttx-planning-system.html


About atesio
atesio turns state-of-the-art mathematical optimization technology into industrial solutions for the telecommunications industry. Leading fixed and mobile operators take strategic decisions (3G, LTE, NGN, FTTX) on the basis of custom-made techno-economic studies by atesio. They also master network optimization and configuration tasks (2G, 3G, SDH, MPLS) by means of atesio's award-winning and powerful network optimization software. atesio was founded in 2000 as a spin-off of a world-wide leading mathematical optimization research institute. For more information, visit: www.atesio.com.


(ends)

Photo: GIS team at the Smallworld User Conference


Ubisense's booth at the Smallworld User Conference
 

Thursday, September 08, 2011

Photo: Ubisense myWorld

The 2011 FOSS4G Map by Jason Sanford

If you’re like me, at any given time you’ve got a number of new software products you’ve been hearing about, but just haven’t had time to tinker with. A few weeks back Peter Batty asked if I’d be interested in creating an interactive map for the upcoming FOSS4G conference that will be here in Denver. This sounded like the perfect opportunity to try out some new open source geo tools.

I’ll start with a link to the map (http://2011.foss4g.org/content/foss4g-map) and tell you a little about how it works and what was used to create it. Visiting the site above displays a slippy map that you can pan and zoom like any other. The initial map shows four FOSS4G Venues as well as some light rail lines and stops to help you get around. As you zoom into the map you’ll see more information about bars, cafes, restaurants and even bicycle rental stations. Clicking these icons will show varying amounts of information in either a popup window or a small panel in the bottom left corner of the map.


All the pieces
The mapping library I’m using is Leaflet, from CloudMade. This is a great library that is very lightweight, easy to use, works great on mobile and most importantly, is open source. The core developer is very responsive to bugs and feature requests which is encouraging for those just getting started with Leaflet. If you haven’t checked out Leaflet yet or haven’t in the last few months, do yourself a favor and take a look. It’s grown by leaps and bounds lately and bugs are squashed often.

As I mentioned before the map shows various local amenities in the downtown Denver area. These come from OpenStreetMap and are periodically updated to keep the map fresh with updates from you. I’m sure you’ve all heard about OpenStreetMap. It’s awesome. End of story.

The OSM data is stored in PostGIS where we reference it for tile creation and map feature selection. PostGIS (/post’-jis/) is a spatial extension of the open source PostgreSQL database. PostGIS essentially adds spatial data types (geometry and geography) and lots (no really, hundreds) of functions to interact with these data types. If your data has a geometry question, PostGIS has one or more functions to answer it. PostGIS has installers for Windows and Mac and even has install packages for various linux flavors. It’s also not terribly hard to compile the source yourself. Even I’ve done this, once without cursing.

I’m creating map tiles with TileMill from Development Seed. TileMill is a browser based map design studio that can read from various data sources including shapefiles, KML, GeoJSON, PostGIS and GeoTIFF. With TileMill you create your map styles with Carto, a CSS-like map styling language that translates to Mapnik styles (correct me if I’m wrong) for super-fast tile rendering. Creating beautiful maps is so easy you’ll forget all about SLD. Recent updates include easy installation for both Mac OS X and Ubuntu (time to fire up the VMs windows users).

The product of a TileMill export is an mbtiles file which is an open spec for storing tiled map data in a SQLite database. This makes it much easier to transfer millions of map tiles to different locations as a single file, not the z/x/y.png directory hell that is the end result of most tiling jobs. I once vowed to quit map tiling efforts. Then I found TileMill. Anyway, we need a way to serve these tiles in this mbtiles format. Development Seed has another piece of open software for serving these, TileStream. You can download the source code for TileStream and build your own service or use a hosted solution for a fee and have your map tiles on a globally distributed CDN. Another solution, and the one I chose, is TileStache which python-based web application written by Michal Migurski that can serve and cache map tiles. With just a few lines of code you can tell TileStache where to find your mbtiles file, what URL to serve them from and where to cache the generated tiles.

Last but certainly not least is MapFish. MapFish is a Pylons (python) based application that lets you Create, Read, Update and Delete (CRUD) geographic features via HTTP POST, GET, PUT and DELETEs. For this application, I’ve extended MapFish to create a select service that simply runs multiple spatial queries against a few layers (bars, cafes, restaurants, bicycle rentals) with just one HTTP request. I’ve been using MapFish for a while now for a number of projects and highly recommend it.
Credit where credit is due
In addition to the projects above, there were a number of other resources used that deserve mention.
The OpenStreetMap data was downloaded from Geofabrik who graciously provide OSM data downloads to the state level updated daily. In my case it was very simple (and fast) to download just the data for Colorado. What an effort! Thanks Geofabrik.
The base map tiles come from MapQuest, who recently as part of their Open MapQuest efforts have released both street and aerial maps free for use, with pretty generous terms. Thanks MapQuest!
Speaking of OSM, our local Denver OSM Meetup Group have had a few recent efforts to help create a more accurate and complete map of downtown Denver. Thanks.
A note to local Denver folks: If you see a missing or incorrect bar, cafe, restaurant, etc in the map, update it in OpenStreetMap. I’ll be pulling fresh OSM data a time or two more before the conference.

About

I’m Jason Sanford. I work for Ubisense building web mapping applications for electric/gas utilities and telcos. Over the last few years working with geospatial technology I’ve found that some of the best help I’ve received came from bloggers simply documenting their experiences, challenges and solutions. My goal here is to do the same.


Check out all of Jason's articles at http://geojason.info/

Monday, August 15, 2011

Latest geothought by Peter Batty


How FOSS4G had a profound impact on my geospatial technology path


As some of you will know, the FOSS4G 2011 conference is coming up in Denver and I am the conference chair. I have only been to one previous FOSS4G, which was in Victoria in Canada in 2007. That event had a profound impact on my perspective on the geospatial industry, and on the software platforms I've chosen to implement geospatial applications on since then. And it has saved my companies a lot of money! So I wanted to share some perspectives about my experience at FOSS4G and what I've learned about open source software, to explain why you should come to FOSS4G, especially if you've never been before.


Back in 2007 I had just left my job as CTO of Intergraph and was weighing up what to do next, and looking at ideas for a geospatial startup company. I'd spent 20 years in the geospatial industry working with closed source products, and knew very little about open source geospatial products. Towards the end of my time at Intergraph, I'd been getting quite a few questions from sales guys, in Canada in particular, about the fact that their customers were showing interest in open source software, which was free, and how should they sell against that? So I'd done a bit of research and had become interested in particular in PostGIS, the open source spatial database, as a possible platform for applications I was looking at in my new (yet to be created) startup, Spatial Networking. The fact that it was free was obviously attractive to a new startup owner, especially as I was looking at a system that (I hoped) would need to be deployed on many servers to cope with large numbers of users.

Open source software tends not to have such flashy marketing material as closed source software, so after a bit of digging around online and not finding all the information I was after, I got in touch with Paul Ramsey, who is one of the main people behind PostGIS. He suggested I should come up to FOSS4G to find out more. I did and was really impressed by the whole experience, both the event in general and what I found out about PostGIS - you can read my writeup at the time here. As I said in that writeup, there was much more energy and buzz than I had seen at other geospatial conferences I was used to attending.

I went ahead and used PostGIS at Spatial Networking and on other projects, including my current project Ubisense myWorld. I continue to be very impressed with PostGIS - it does all the core things you expect a spatial database to do (I had a lot of previous experience with Oracle Spatial and other systems), and it's FREE! I have never hit a bug during my time using it.

So what have I learned about open source geospatial software in those four years? First of all let me say that I have no strong predisposition to open or closed source development approaches, per se. I am happy to chose either open or closed source products depending on what I need in a given situation. What I do have s strong predisposition to is FREE. Obviously a product needs to meet your requirements, but assuming it does then free is rather attractive compared to having to pay for something. This is especially true in a cloud environment, where you may scale up to running many servers, and traditional per server licensing costs can really hurt you financially.
People in the closed source world often raise concerns about support in the open source world. My experience hasn't borne out this concern. With PostGIS, I've never needed support, it just works. With MapFish, another open source product we're using for myWorld, we needed a few enhancements. Some were addressed by the community within a month or two, others we were able to do ourselves as we had access to the product source code. I very much doubt that we could have got enhancements made in a mature closed source product in that timeframe. There are also more and more options in the open source geospatial world to pay people to do enhancements or fixes for you. Again it's a bit dangerous to make generalizations, you can get good support or poor support on different closed source products, and you can get good support or poor support on different open source products. But my experience with the open source products we've chosen has been very good.

I think that after price, perhaps the aspect of open source that I value most is longevity and predictability. Many times during my career, I have seen projects suffer because a vendor has decided to stop development of a product (or feature). I have also seen dramatic changes in terms of service or costs of online services. Google App Engine is one example of the latter - many people put significant effort into developing applications that were running for free, then Google changed the pricing model and people found themselves facing large costs they hadn't planned on. With an open source product that has a strong community behind it, there is much more long term stability. You know it's not going to go away tomorrow. Even if some developers leave, others are there to cover for them. And in the worst case you have access to the source code so could continue to maintain it yourself (though that's a very unlikely scenario as long as the community of developers has a certain critical mass). I have been moving more components of myWorld towards open source because of this predictability.

So anyway, if you are still paying for geospatial software you owe it to yourself and your company to come to FOSS4G and find out what all this open source software is about. There is a parallel universe out there with software products that have great capabilities and are FREE! It's also worth saying that in general there is good interoperability between open and closed source systems, so it's not an all or nothing proposition. In general open source web and database products are very strong, and they may well be able to complement your investment in existing applications.

This is the first time that FOSS4G has been in North America for 4 years, and it is not likely to be here again for another 3, so this is a rare opportunity if you are based here to meet a wide range of people developing and using these products. So I hope to see you in Denver in September at FOSS4G!

 end


Peter Batty is VP of geospatial technology at Ubisense. He has worked in the geospatial industry for 20 years and has served as CTO for two leading companies in the industry (and two of the world's top 200 software companies), Intergraph and Smallworld (now part of GE Energy), as well as a being a founder and CTO of Ten Sails, who provided early stage funding to and later merged with Ubisense. He serves on the Advisory Board of FortiusOne. See here for a more detailed bio. You can email Peter at peter@ebatty.com, and can see videos of some of his conference presentations here.


For more articles visit http://geothought.blogspot.com/